<?xml version="1.0" encoding="utf-8"?><feed xmlns="http://www.w3.org/2005/Atom" ><generator uri="https://jekyllrb.com/" version="4.4.1">Jekyll</generator><link href="https://retirementmodeler.com/blog/feed.xml" rel="self" type="application/atom+xml" /><link href="https://retirementmodeler.com/blog/" rel="alternate" type="text/html" /><updated>2026-09-18T10:25:00-04:00</updated><id>https://retirementmodeler.com/blog/feed.xml</id><title type="html">Retirement Scenario Modeler</title><subtitle>Plain-English notes on the retirement maths behind the free Retirement Scenario Modeler: RMDs, Social Security timing, sequence-of-returns risk, and what the projections actually assume.</subtitle><author><name>Chris Savage</name></author><entry><title type="html">Your Coast FIRE number is lower than you think</title><link href="https://retirementmodeler.com/blog/2026/09/your-coast-fire-number-is-lower-than-you-think/" rel="alternate" type="text/html" title="Your Coast FIRE number is lower than you think" /><published>2026-09-04T09:00:00-04:00</published><updated>2026-09-04T09:00:00-04:00</updated><id>https://retirementmodeler.com/blog/2026/09/your-coast-fire-number-is-lower-than-you-think</id><content type="html" xml:base="https://retirementmodeler.com/blog/2026/09/your-coast-fire-number-is-lower-than-you-think/"><![CDATA[<p>Coast FIRE is the most useful idea the financial independence movement has
produced, and it is the one most often calculated wrong.</p>

<p>The idea is simple enough to hold in your head. There is some balance which, if
you never added another dollar to it, would grow on its own into a retirement
you can actually afford. Reach it and the arithmetic changes character: you still
have to earn a living, but you no longer have to save. You can take the job that
pays less. You can go to four days a week. You can stop opening the statement.</p>

<p>The number is worth knowing precisely, because people make real decisions with
it. And the formula everybody uses to find it is wrong in a specific and
consistent direction: it tells you the number is much bigger than it is.</p>

<h2 id="the-formula-everyone-uses">The formula everyone uses</h2>

<p>Every Coast FIRE calculator on the internet does the same two steps.</p>

<p>First, your FI number (what you need on the day you retire) is your annual
spending divided by a safe withdrawal rate, conventionally 4%. That is the
familiar 25x.</p>

<p>It is worth being clear which way that dial turns, because it reads backwards to
almost everyone the first time. The withdrawal rate is not how much you spend.
Your spending is whatever you decided it was. It is what <em>fraction of the portfolio</em>
that spending represents. So a more cautious 3.5% is 29x rather than 25x, and it
asks for a <strong>bigger</strong> pot, not a smaller one, because the same $70,000 has to
come out of a portfolio you are willing to draw on more lightly.</p>

<p>Then discount it back to today at your expected real return:</p>

<div class="language-plaintext highlighter-rouge"><div class="highlight"><pre class="highlight"><code>Coast number = FI number / (1 + r)^years
</code></pre></div></div>

<p>Take a 42-year-old who wants $70,000 a year and plans to stop at 65. Their FI
number is $1,750,000. At 7% growth and 2.5% inflation the real return is 4.4%,
and over 23 years that discounts to <strong>$651,418</strong>.</p>

<p>So: $651,418 today, and you never have to save again. It is a clean piece of
arithmetic and it has the great virtue of fitting on a napkin.</p>

<p>It is also describing a retirement that almost nobody has.</p>

<h2 id="it-assumes-your-portfolio-pays-for-everything">It assumes your portfolio pays for everything</h2>

<p>Look at what 25x actually says. It says your portfolio must produce every dollar
you spend, for the rest of your life, on its own.</p>

<p>For most people it does not have to. Social Security is going to pay something.
Many people have a pension. Some have rental income. Those are not rounding
errors. For a household spending $70,000 a year, a $30,000 Social Security
benefit is nearly half the bill, arriving every year, inflation-adjusted, for as
long as you live. The formula has no way to express it, so it silently asks you
to save as though it did not exist.</p>

<p>There is a second, quieter assumption. The 4% rule is built to survive
<em>indefinitely</em>: it is designed so the money never runs out, no matter how long
you live. A projection that runs to 100 is answering a narrower question, and a
narrower question needs less money.</p>

<p>The Coast FIRE tab on this site does not use the formula. It takes the plan you
have already described (your accounts, your spending, your Social Security
timing, your tax rates) switches every contribution off, yours and your
employer’s, and runs the whole projection forward. Then it solves for the balance
that just carries it. Same household, same day, both numbers:</p>

<figure class="wide">
  <img class="shot-light" src="/blog/assets/img/coast/contrast-light.png" alt="Three cards side by side. Rule of thumb: $651,418, from $1,750,000 at retirement, 25x spending at 4%, discounted 4.4% real over 23 years. Your coast number: $367,149, from the full projection with nothing further paid in. Your balance today: $210,000, which is $157,149 below the requirement." width="2432" height="282" loading="lazy" />
  <img class="shot-dark" src="/blog/assets/img/coast/contrast-dark.png" alt="" width="2432" height="282" loading="lazy" />
  <figcaption>The same 42-year-old, asked twice. The napkin says $651,418. The projection says $367,149.</figcaption>
</figure>

<p>The gap is $284,269. It is not a rounding difference or a modelling quibble:
it is 44% of the number, and it is the difference between “I am nowhere near”
and “I am closer than I thought”.</p>

<p>It comes from the two assumptions, and they can be separated. Run the same
household with Social Security deleted and the projection asks for $547,646:</p>

<table>
  <thead>
    <tr>
      <th>Coast number for the same household</th>
      <th>Amount</th>
    </tr>
  </thead>
  <tbody>
    <tr>
      <td>Rule of thumb, 25x discounted</td>
      <td>$651,418</td>
    </tr>
    <tr>
      <td>Full projection, no Social Security</td>
      <td>$547,646</td>
    </tr>
    <tr>
      <td>Full projection, $30,000 of Social Security at 67</td>
      <td>$367,149</td>
    </tr>
  </tbody>
</table>

<p>So about $104,000 of the gap is the 4% rule aiming at perpetuity where the
projection aims at age 100, and about $180,000 of it is Social Security. The
second is the larger effect, and it is the one the napkin cannot ever capture,
because there is nowhere in <code class="language-plaintext highlighter-rouge">FI / (1 + r)^n</code> to put it.</p>

<h2 id="where-the-line-actually-is">Where the line actually is</h2>

<p>The number on its own is a milestone with no date attached. The more useful
question is when you get there, and that has a shape worth looking at.</p>

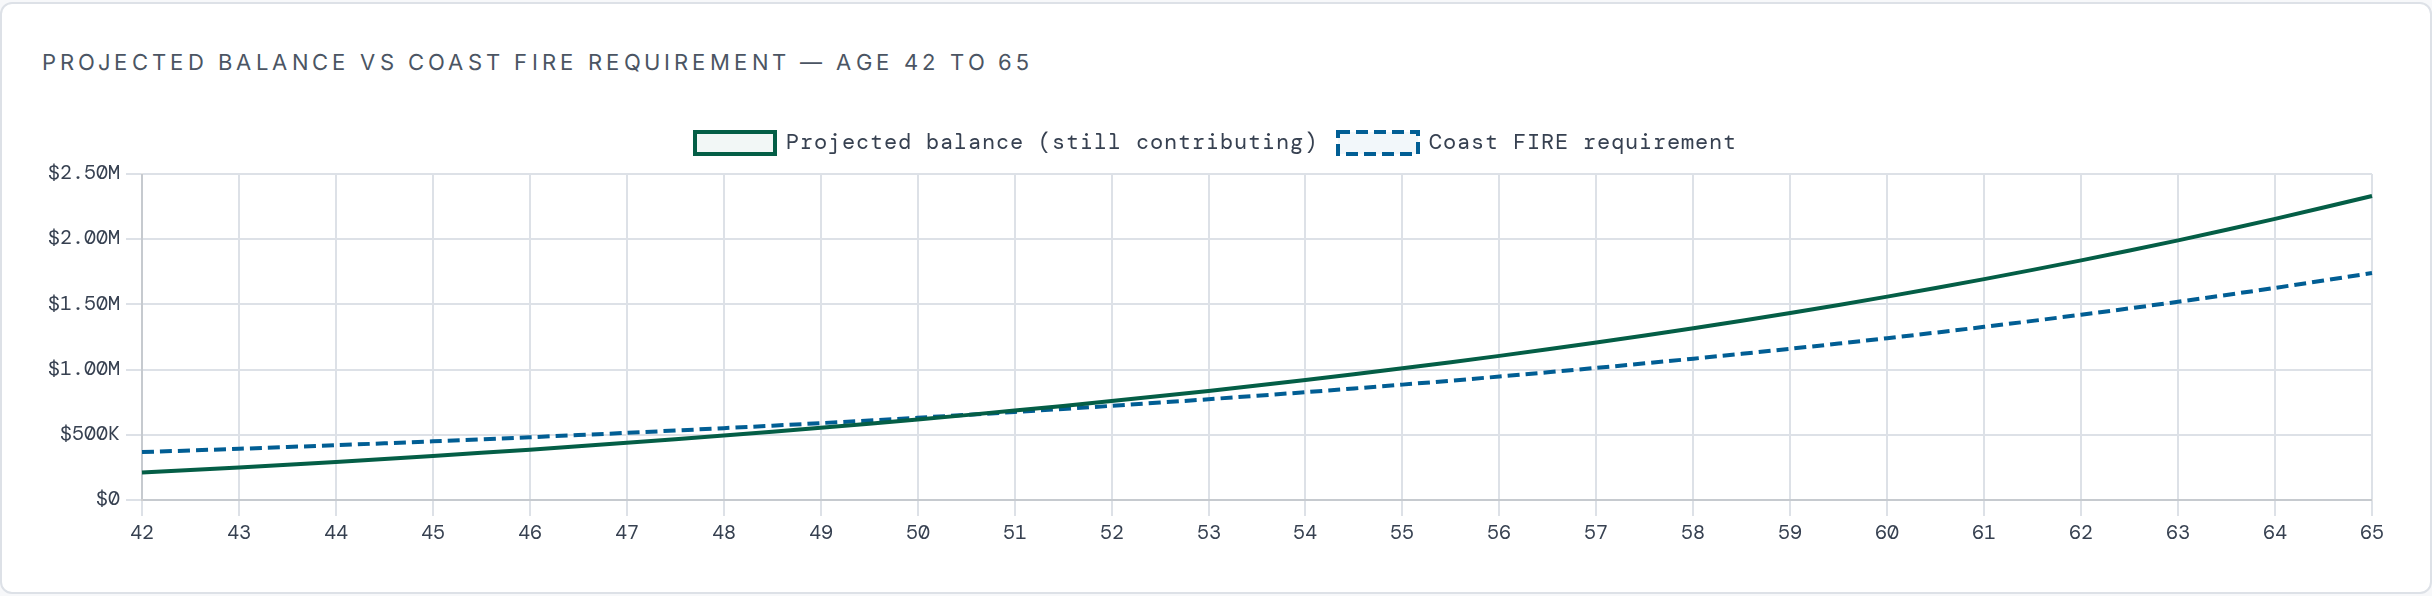
<p>Two lines. One is your balance if you carry on contributing exactly as you are.
The other is what you would need at each age to coast from that age, which
rises, because every year you wait is a year of compounding you no longer get.
Where they meet is your Coast FIRE date.</p>

<figure class="wide">
  <img class="shot-light" src="/blog/assets/img/coast/crossing-light.png" alt="A line chart from age 42 to 65. A solid green line, the projected balance while still contributing, starts at $210,000 and curves up to about $2.3 million. A dashed blue line, the coast requirement, starts higher at about $370,000 and rises more gently. The two cross at age 51, after which the green line pulls steadily away." width="2432" height="596" loading="lazy" />
  <img class="shot-dark" src="/blog/assets/img/coast/crossing-dark.png" alt="" width="2432" height="596" loading="lazy" />
  <figcaption>Coasting from 42 needs $367,149. This saver has $210,000 and pays in $25,000 a year, so the lines meet at 51.</figcaption>
</figure>

<p>Nine years, not never. That is the thing the chart tells you that the number
alone does not: this saver is not choosing between saving until 65 and giving up.
They are nine years from the point where continuing to save becomes optional.</p>

<p>Notice also how the two lines behave after they cross. The requirement keeps
rising, but the balance rises faster, because it is compounding <em>and</em> being fed.
Past the crossing, every additional year of contributions is buying margin: an
earlier retirement, a bigger number, a worse decade absorbed, rather than the
plan itself.</p>

<h2 id="what-this-is-assuming">What this is assuming</h2>

<p>Coast FIRE is a projection, and it inherits every weakness projections have.
Four are worth stating plainly.</p>

<p><strong>The spending target is doing most of the work, and it is the number most
likely to be wrong.</strong> Everything above is downstream of $70,000 a year. Expenses
at 42 rarely resemble expenses at 65. Children arrive and leave, parents need
help, houses need roofs. If the real figure turns out to be $85,000, the coast
number moves by more than any assumption argued about on the internet.</p>

<p><strong>A flat 7% hides the order the returns arrive in.</strong> The projection grows the
balance by the same percentage every year. Real markets do not, and a bad first
decade of coasting cannot be made up by a good second one in the way the average
implies. The Monte Carlo tab exists for exactly this reason; run the plan through
it before you act on a single deterministic line.</p>

<p><strong>Stopping early means paying for health insurance yourself.</strong> Anyone who coasts
out of a job with benefits before 65 is buying their own cover until Medicare,
and that is a real annual cost this projection does not model as a separate item.
If that is the plan, put it in the spending target.</p>

<p><strong>Coasting is easier to start than to stop.</strong> This one is not arithmetic. The
habit of saving is difficult to restart once broken, and the flexibility you
bought by coasting can quietly become a floor you cannot climb off. Reaching the
number is permission to stop, not an instruction to.</p>

<p>And one thing that is not a caveat but is often mistaken for one: the projection
lets the portfolio run down toward zero by 100. That is deliberate, since money
left over at 100 is money that was not spent, but it is a different target from the
4% rule’s, and it is part of why the numbers differ.</p>

<h2 id="what-to-do-with-this">What to do with this</h2>

<p>Put your own figures into the <a href="/">calculator</a>, real balances and real
contributions, your actual Social Security estimate from ssa.gov rather than a
guess, and open the Coast FIRE tab. It will show you both numbers, the gap
between them, and the age the lines cross.</p>

<p>Then do the thing the number is actually for, which is not to stop saving. It is
to find out how much of your current saving is load-bearing. Most people
discover they are further along than the napkin told them, and that some part of
what they are putting away is buying margin rather than buying the retirement.
Knowing which is which is what lets you make the trade deliberately (fewer
hours, a better job, a worse-paid one that you like) instead of saving hard
until 65 because nobody ever told you when you could stop.</p>

<p>If the compounding underneath all of this is unfamiliar,
<a href="/blog/2026/08/the-ten-years-that-beat-thirty/">the ten years that beat thirty</a>
makes the same point from the other end: it is time, not the rate, that does the
work.</p>

<div class="callout">
  <p><strong>A standing caveat.</strong> These are projections, not predictions, and every figure
here came out of one household’s assumptions. Nothing on this site is financial,
tax or legal advice, and no calculator knows what the next thirty years of
markets will do, including this one. Use it to understand the shape of the
problem, then talk to someone who is licensed to advise you on your own.</p>
</div>]]></content><author><name>Chris Savage</name></author><category term="compounding" /><category term="methodology" /><summary type="html"><![CDATA[The formula every Coast FIRE calculator uses assumes your portfolio pays for all of retirement. Most people's does not have to. What Social Security does to the number, and how to work it out properly.]]></summary><media:thumbnail xmlns:media="http://search.yahoo.com/mrss/" url="https://retirementmodeler.com/blog/assets/img/cards/your-coast-fire-number-is-lower-than-you-think.png" /><media:content medium="image" url="https://retirementmodeler.com/blog/assets/img/cards/your-coast-fire-number-is-lower-than-you-think.png" xmlns:media="http://search.yahoo.com/mrss/" /></entry><entry><title type="html">The ten years that beat thirty</title><link href="https://retirementmodeler.com/blog/2026/08/the-ten-years-that-beat-thirty/" rel="alternate" type="text/html" title="The ten years that beat thirty" /><published>2026-08-29T09:00:00-04:00</published><updated>2026-08-29T09:00:00-04:00</updated><id>https://retirementmodeler.com/blog/2026/08/the-ten-years-that-beat-thirty</id><content type="html" xml:base="https://retirementmodeler.com/blog/2026/08/the-ten-years-that-beat-thirty/"><![CDATA[<p>Arguments about retirement saving nearly always end up being arguments about the
return rate. 7% or 5%. Index funds or something cleverer. Whether
the next decade will look like the last one.</p>

<p>It is the wrong thing to argue about, or at least the wrong thing to argue about
first. The input that does the most work in any of these projections is not the
rate. It is how long the money is left alone.</p>

<p>Here is that claim with numbers attached. Everything below came out of the
<a href="/">calculator</a> on this site, one run at a time, with nothing changed between
runs except a birthday.</p>

<h2 id="same-6000-three-starting-lines">Same $6,000, three starting lines</h2>

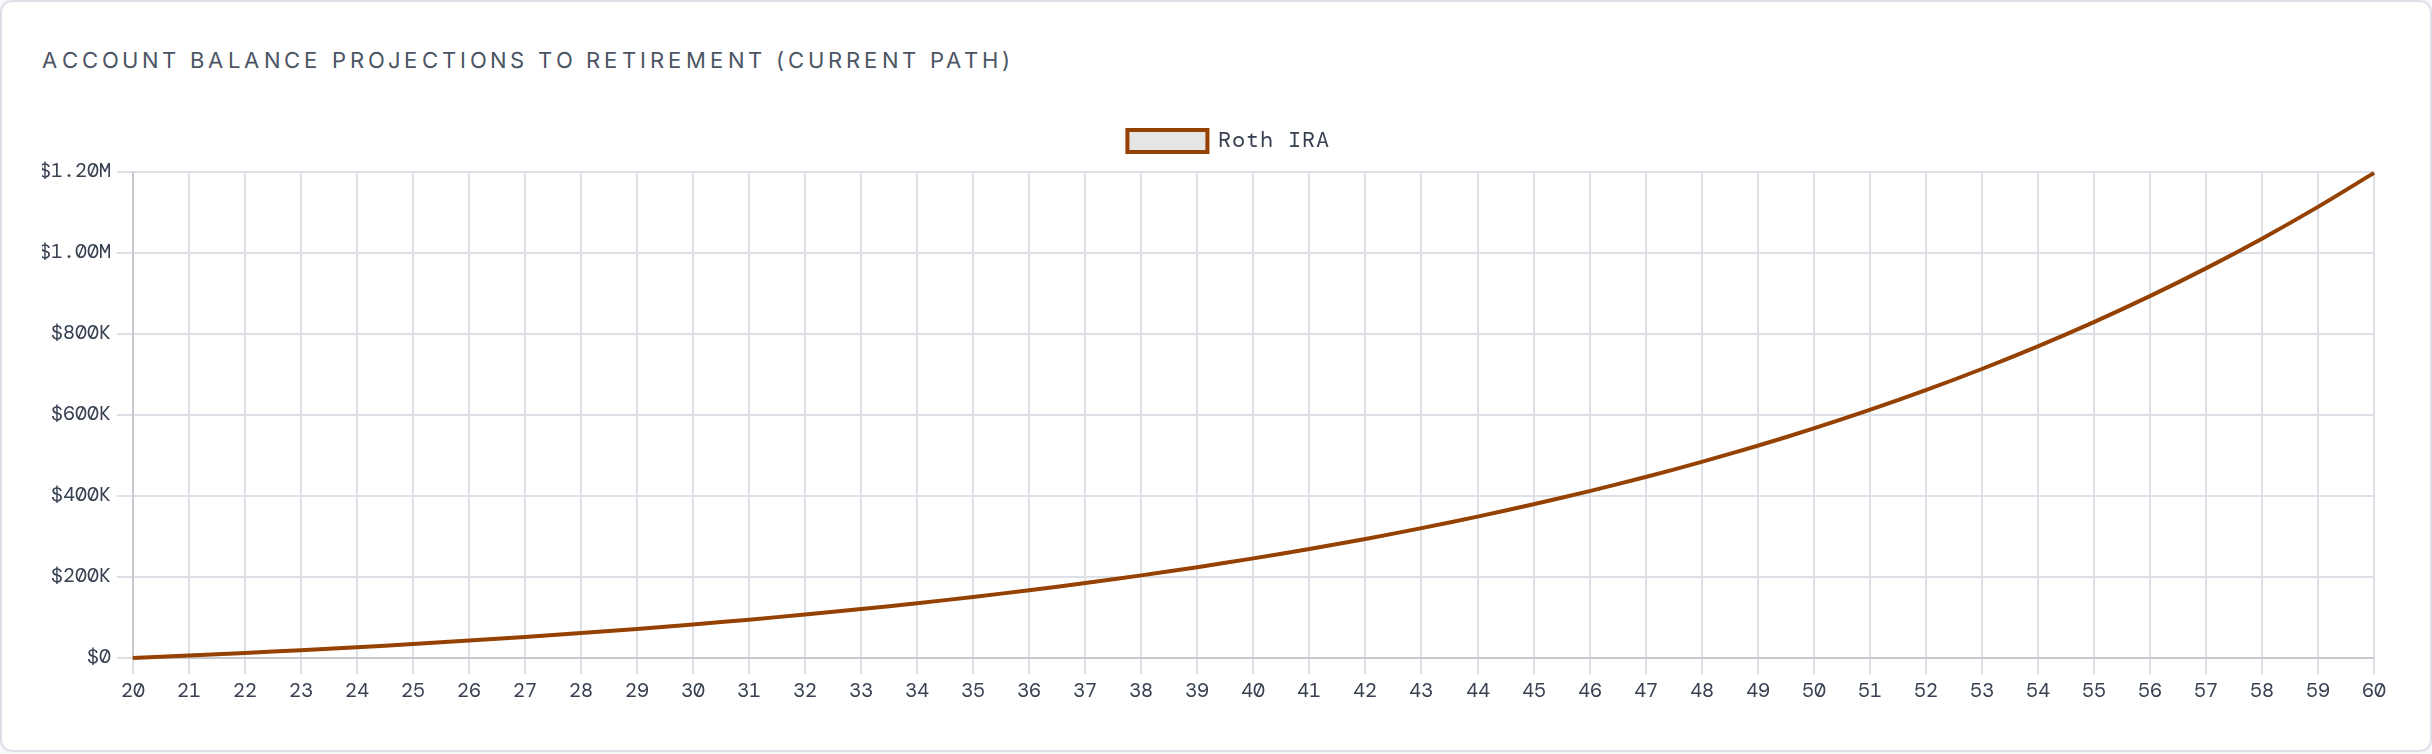
<p>One Roth IRA. $6,000 a year, which is $500 a month. 7% a year. Stop at 60.</p>

<p>The only difference is when the first payment goes in.</p>

<figure class="wide">
  <img class="shot-light" src="/blog/assets/img/compound/start-20-light.png" alt="Balance projection for a Roth IRA funded with $6,000 a year from age 20. The line is nearly flat through the twenties, lifts through the forties, and climbs steeply to about $1.2 million by age 60." width="2432" height="754" loading="lazy" />
  <img class="shot-dark" src="/blog/assets/img/compound/start-20-dark.png" alt="" width="2432" height="754" loading="lazy" />
  <figcaption>Starting at 20. Forty years, $240,000 paid in, $1,197,811 at the end.</figcaption>
</figure>

<figure class="wide">
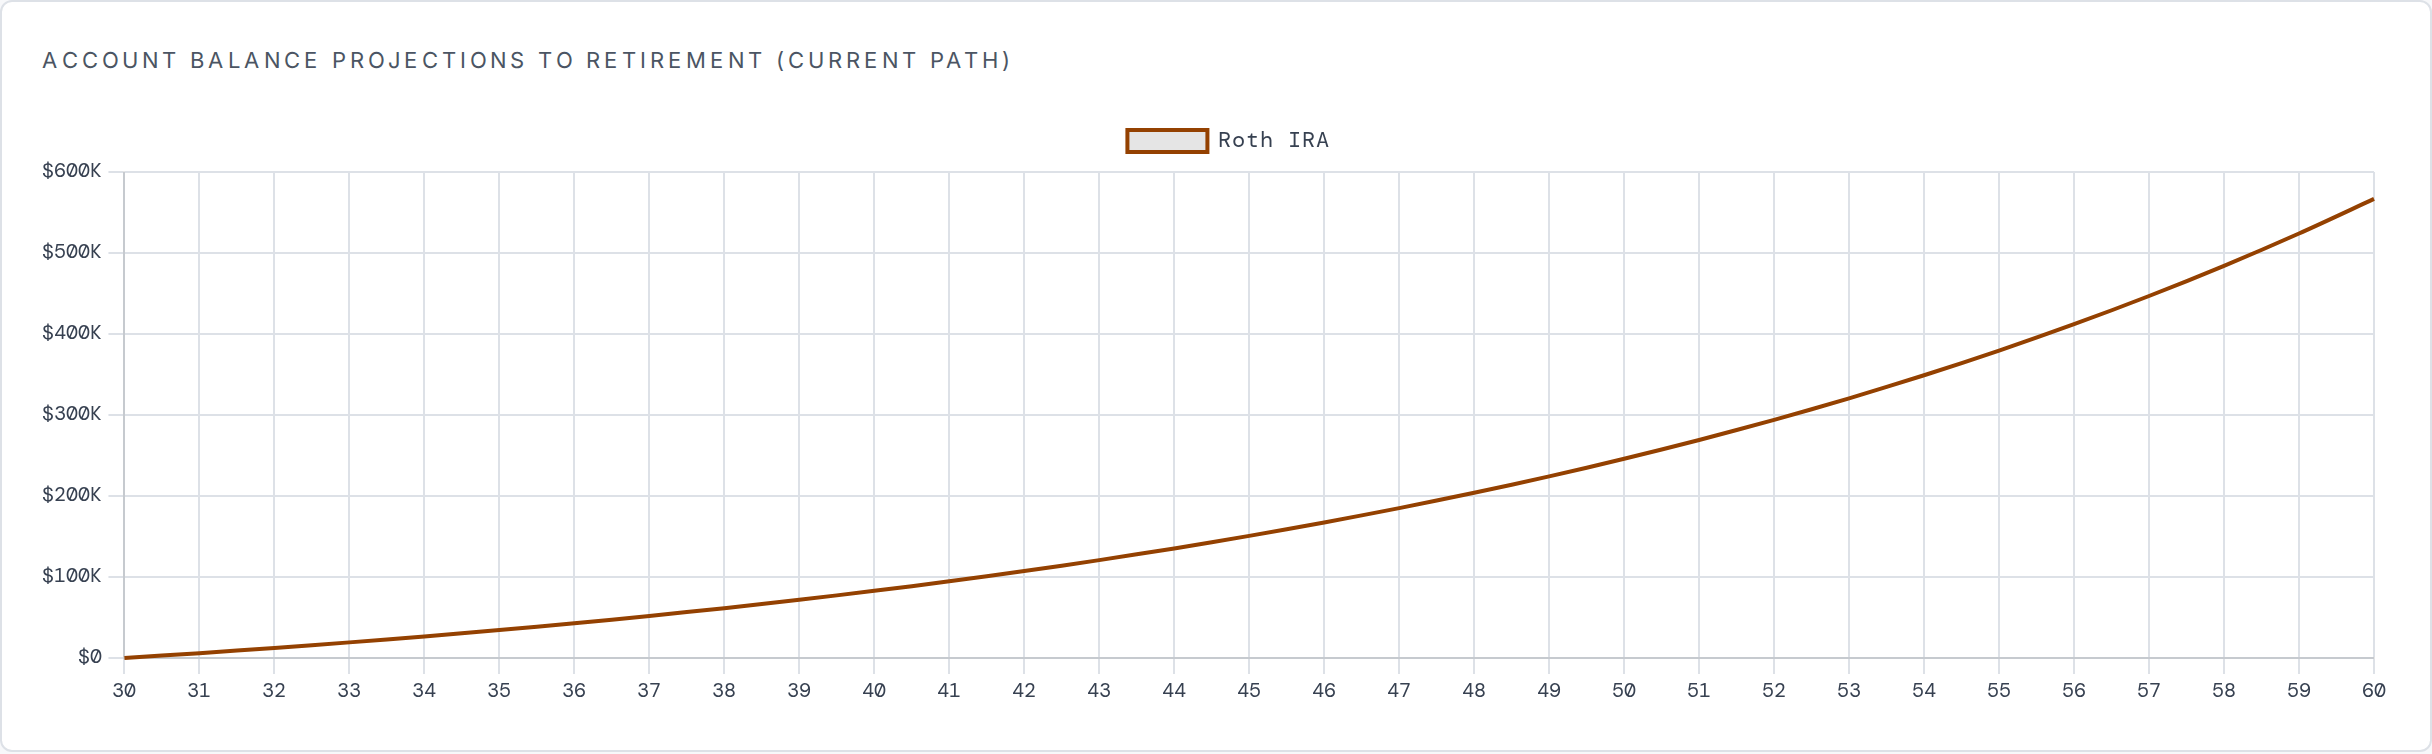
  <img class="shot-light" src="/blog/assets/img/compound/start-30-light.png" alt="The same projection begun at age 30. The curve has the same shape but ends at about $567,000 at age 60." width="2432" height="754" loading="lazy" />
  <img class="shot-dark" src="/blog/assets/img/compound/start-30-dark.png" alt="" width="2432" height="754" loading="lazy" />
  <figcaption>Starting at 30. Thirty years, $180,000 paid in, $566,765 at the end.</figcaption>
</figure>

<figure class="wide">
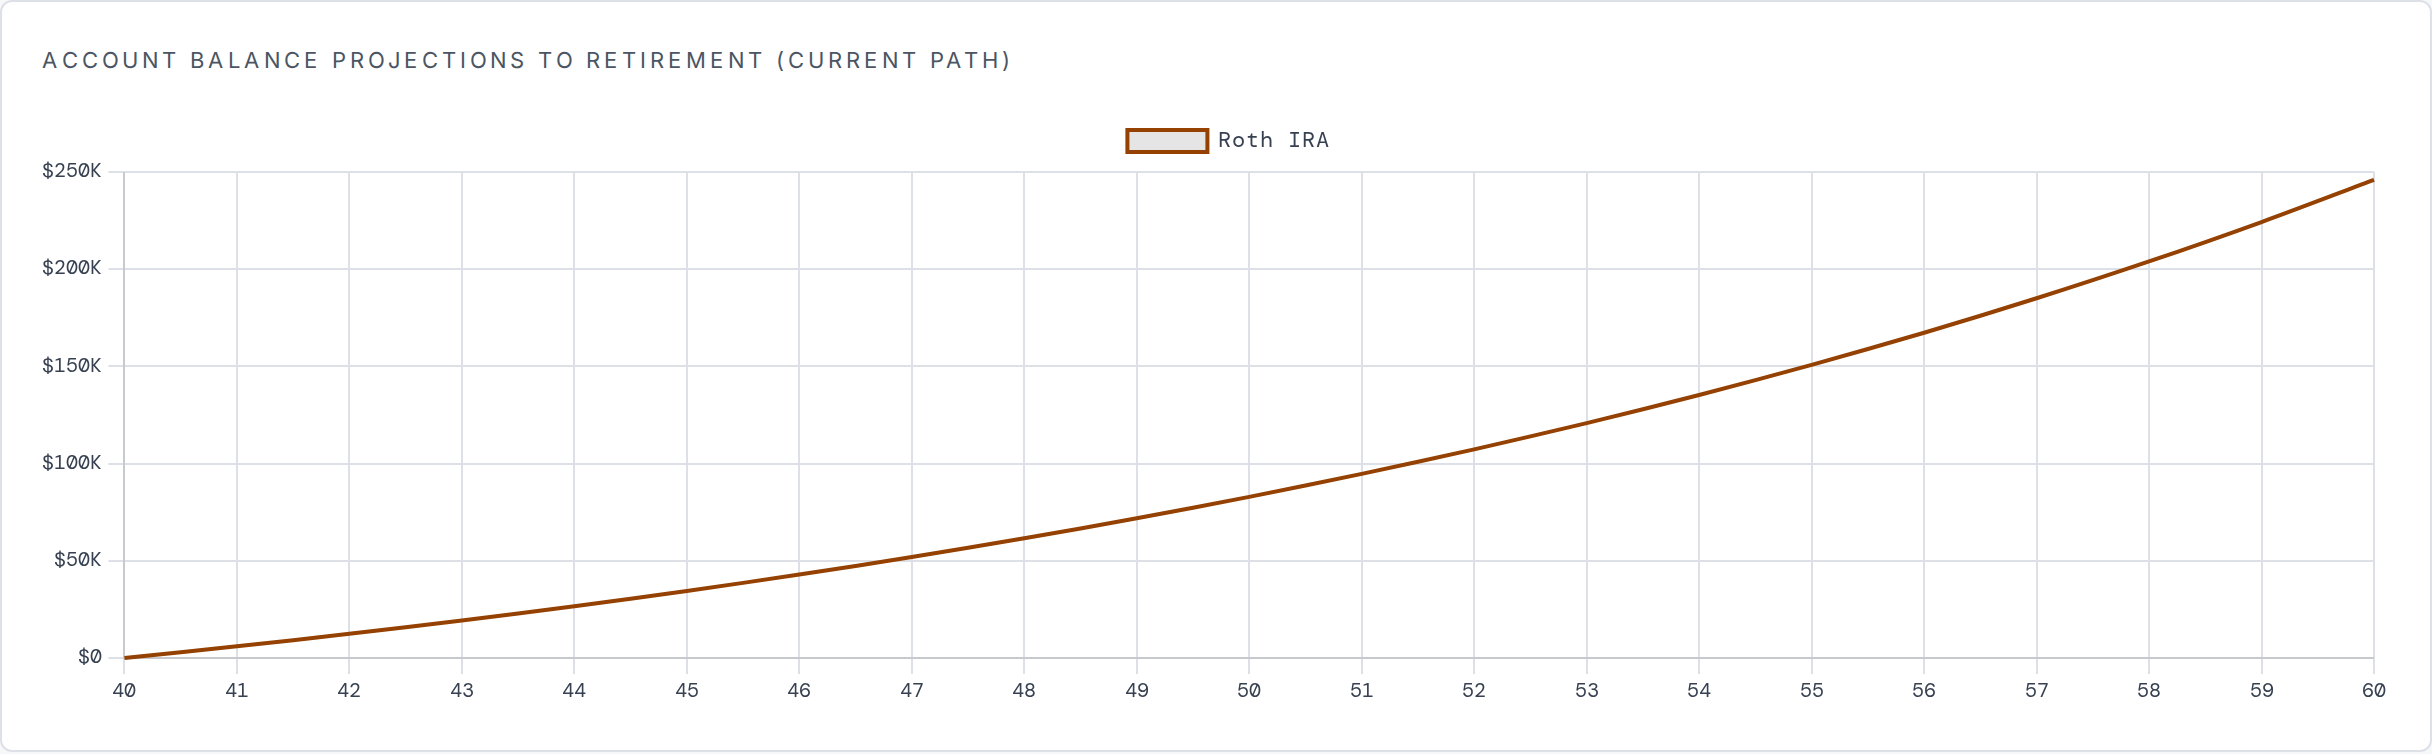
  <img class="shot-light" src="/blog/assets/img/compound/start-40-light.png" alt="The same projection begun at age 40. Only twenty years of growth, ending near $246,000 at age 60." width="2432" height="754" loading="lazy" />
  <img class="shot-dark" src="/blog/assets/img/compound/start-40-dark.png" alt="" width="2432" height="754" loading="lazy" />
  <figcaption>Starting at 40. Twenty years, $120,000 paid in, $245,973 at the end.</figcaption>
</figure>

<table>
  <thead>
    <tr>
      <th>Start</th>
      <th>Years</th>
      <th>Paid in</th>
      <th>At 60</th>
    </tr>
  </thead>
  <tbody>
    <tr>
      <td>20</td>
      <td>40</td>
      <td>$240,000</td>
      <td>$1,197,811</td>
    </tr>
    <tr>
      <td>30</td>
      <td>30</td>
      <td>$180,000</td>
      <td>$566,765</td>
    </tr>
    <tr>
      <td>40</td>
      <td>20</td>
      <td>$120,000</td>
      <td>$245,973</td>
    </tr>
  </tbody>
</table>

<p>The twenty-year-old pays in twice what the forty-year-old does and ends up with
nearly five times as much. That gap is not a reward for being twice as diligent.
It is what the extra twenty years did to the same deposits.</p>

<h2 id="the-last-decade-does-most-of-the-work">The last decade does most of the work</h2>

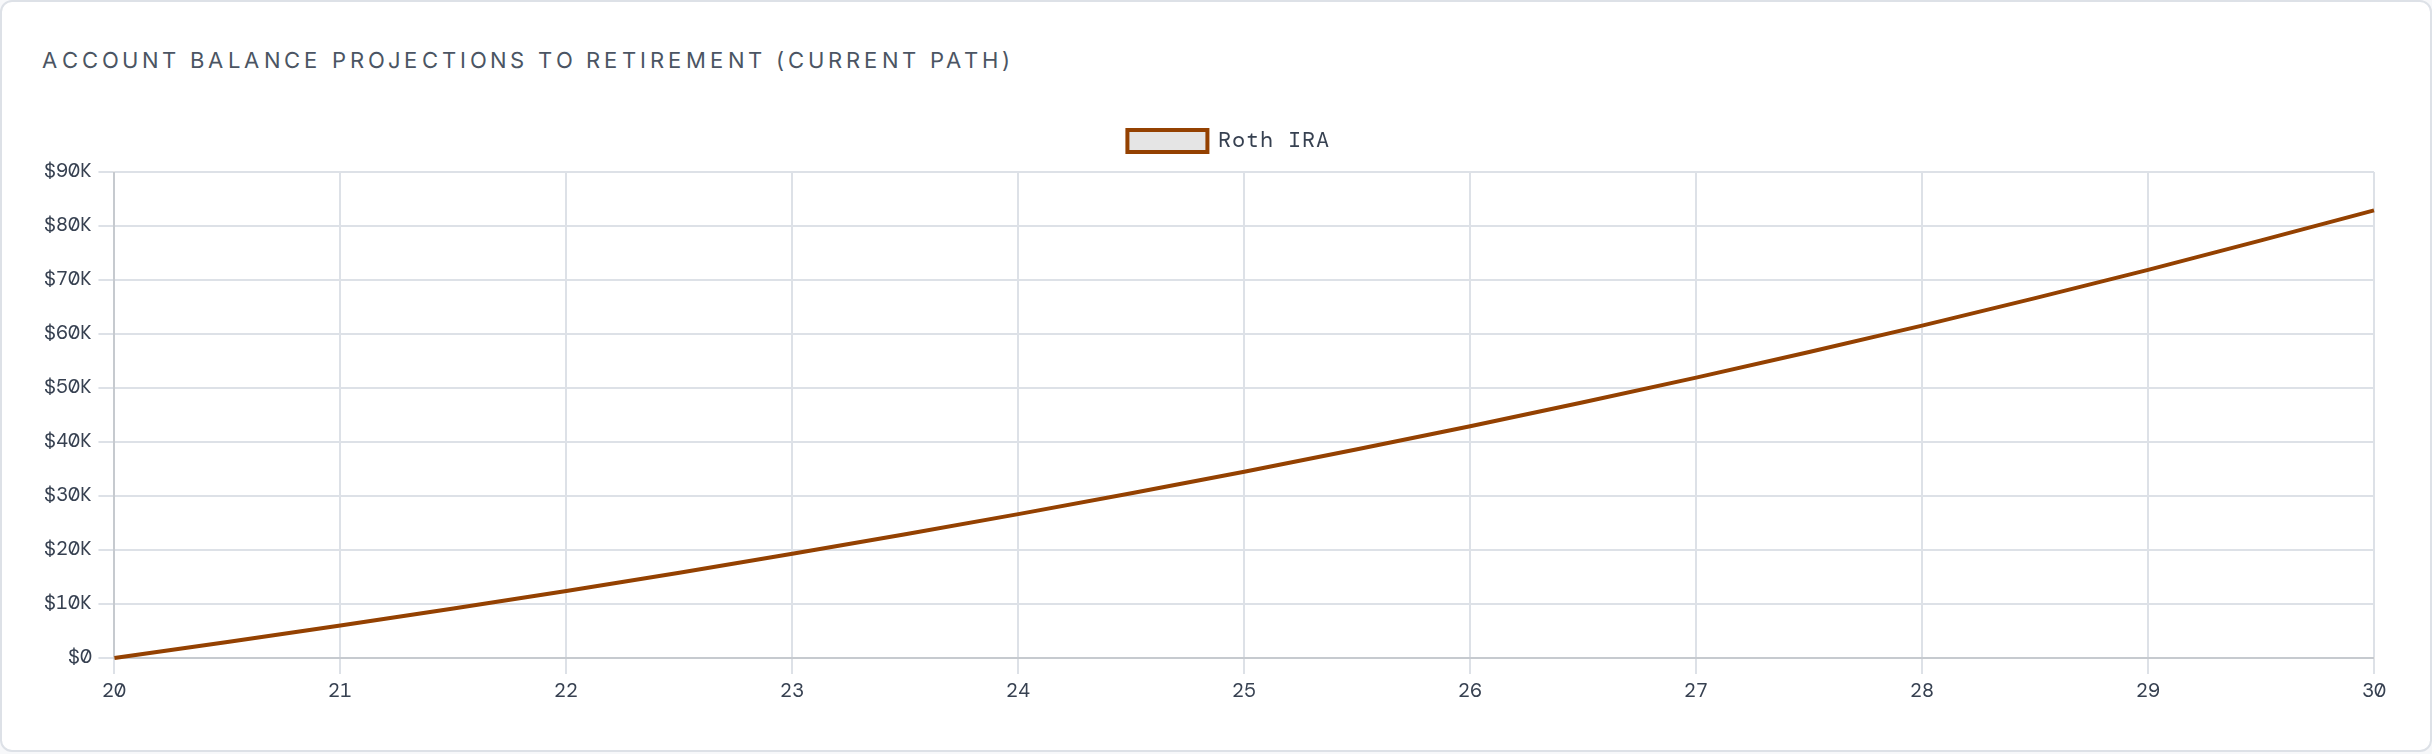
<p>Look at the first chart again. For most of the twenties the line is flat enough
to be discouraging. After ten years of paying in, the account holds $82,899,
and $60,000 of that is money that was simply handed over. Nothing much appears
to be happening.</p>

<p>Then look at where the balance actually arrives.</p>

<p>At 7% a balance doubles a little over every ten years. So the years you add at
the <em>front</em> of a plan are not worth what they look like at the time; they are
worth whatever the last doubling turns them into. Run the numbers on that first
chart and the final ten years, from 50 to 60, add $631,046, which is more than
the first thirty years produced in total.</p>

<p>That is the whole argument, and it cuts both ways. The years are cheap when you
have them and unbuyable once you don’t.</p>

<h2 id="the-ten-years-that-beat-thirty">The ten years that beat thirty</h2>

<p>There is an old illustration that gets passed around, usually without anyone
checking it. Someone saves hard through their twenties, stops completely at 30,
and never adds another dollar. Someone else starts at 30 and pays in steadily
for the next thirty years. The claim is that the first one wins.</p>

<p>They do.</p>

<p>Getting this out of the calculator takes two passes, because an account here
carries one contribution figure that runs until you retire. There is no “stop
paying in at 30” field, and inventing one would complicate every other plan to
serve this one story. So: run it to 30, read the balance, then start a second
plan from that balance with the contribution set to zero.</p>

<figure class="wide">
  <img class="shot-light" src="/blog/assets/img/compound/decade-light.png" alt="Balance projection from age 20 to 30 with $6,000 paid in each year, ending just under $83,000." width="2432" height="754" loading="lazy" />
  <img class="shot-dark" src="/blog/assets/img/compound/decade-dark.png" alt="" width="2432" height="754" loading="lazy" />
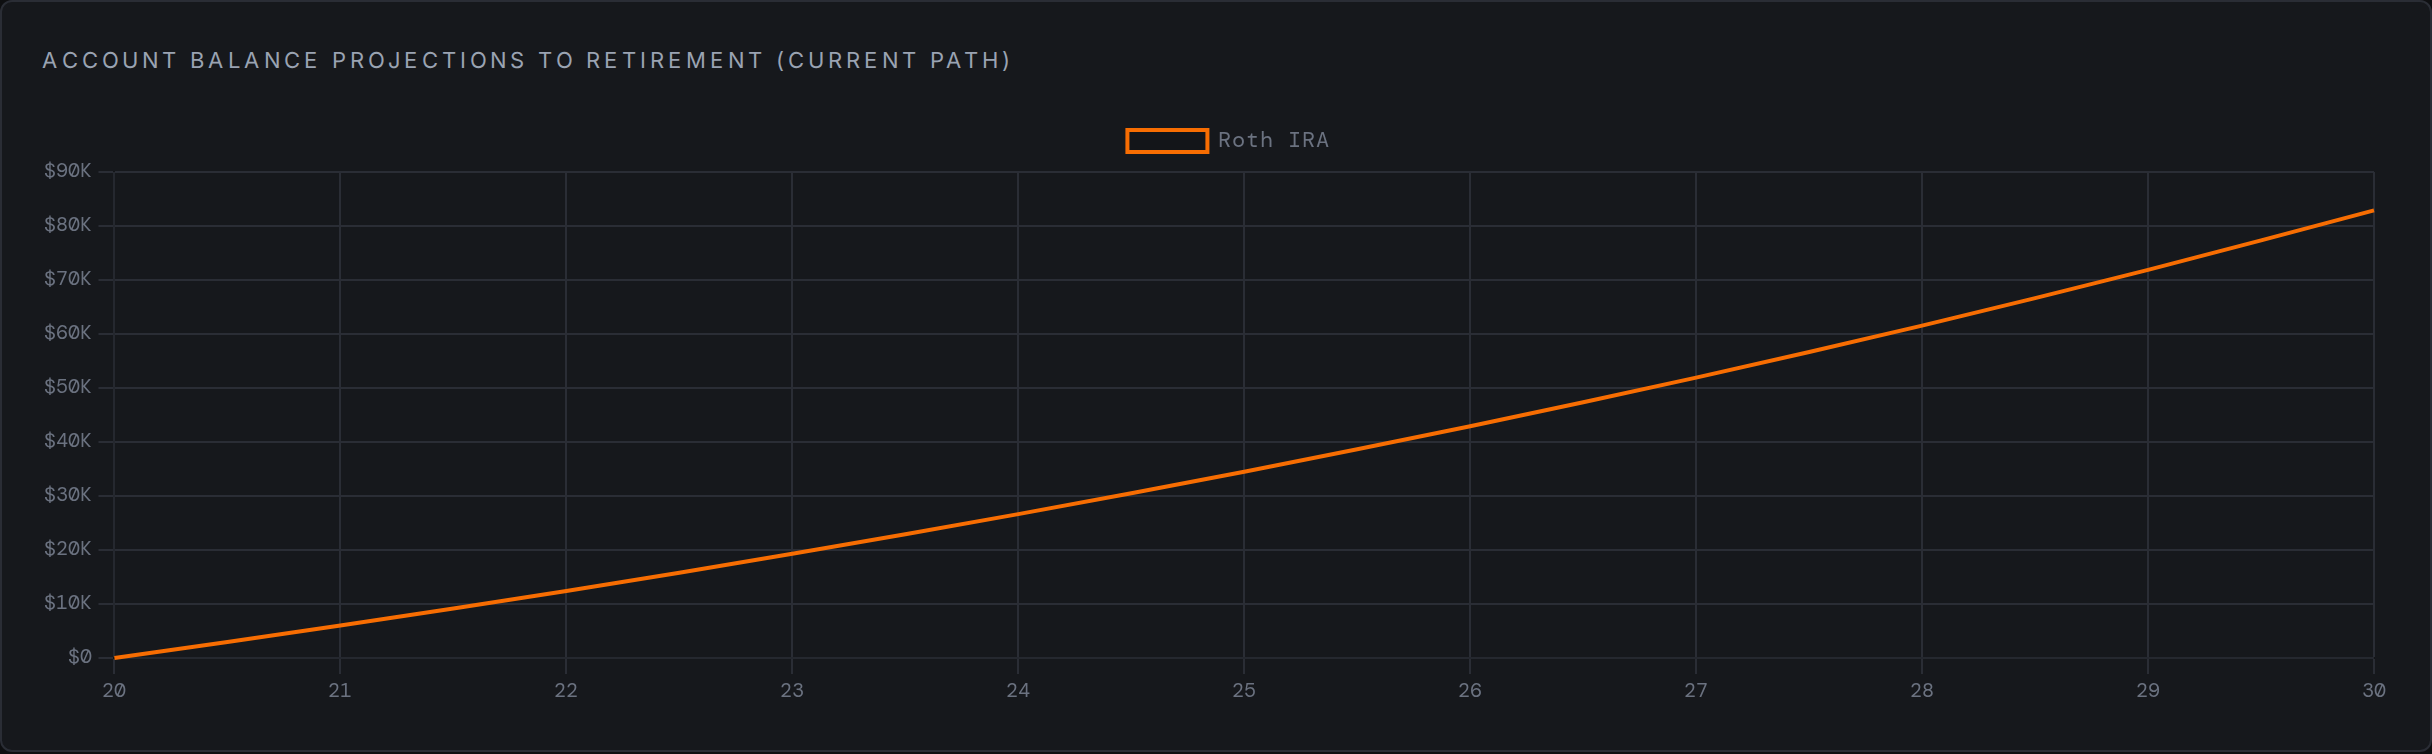
  <figcaption>Ten years of paying in, 20 to 30. $60,000 handed over, $82,899 in the account.</figcaption>
</figure>

<figure class="wide">
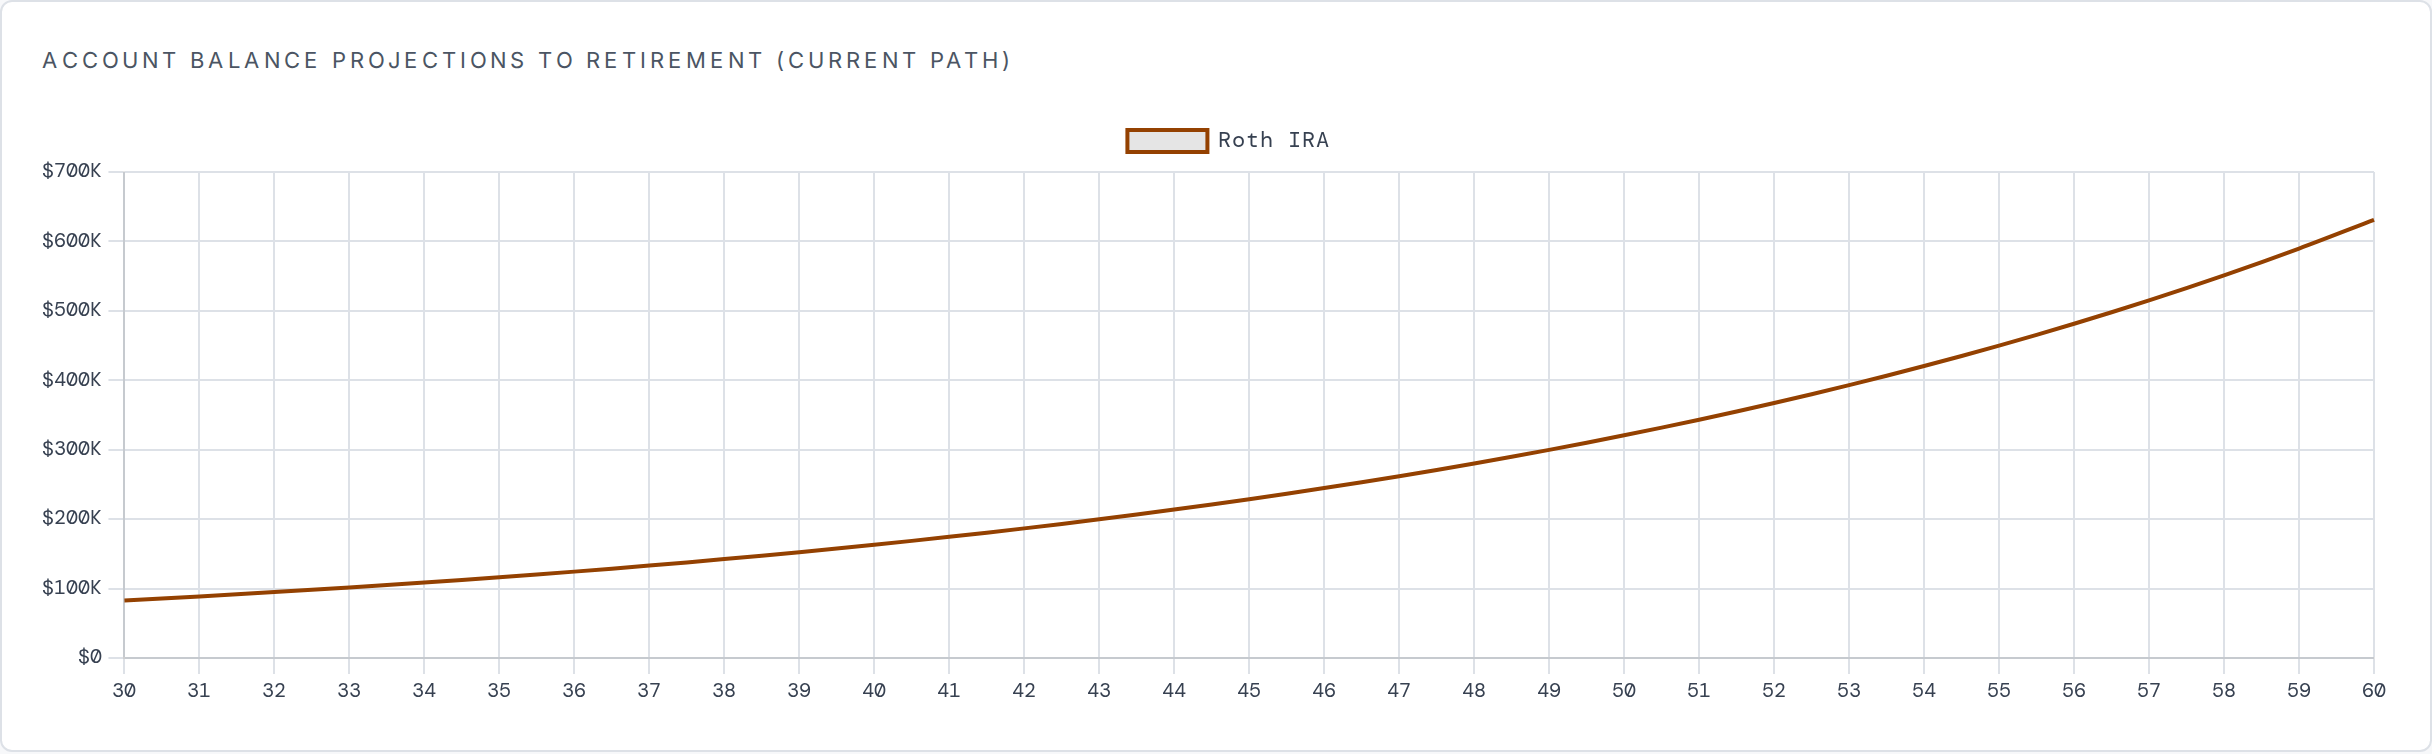
  <img class="shot-light" src="/blog/assets/img/compound/coast-light.png" alt="Balance projection from age 30 to 60 starting at $82,899 with no further contributions, rising to about $631,000." width="2432" height="754" loading="lazy" />
  <img class="shot-dark" src="/blog/assets/img/compound/coast-dark.png" alt="" width="2432" height="754" loading="lazy" />
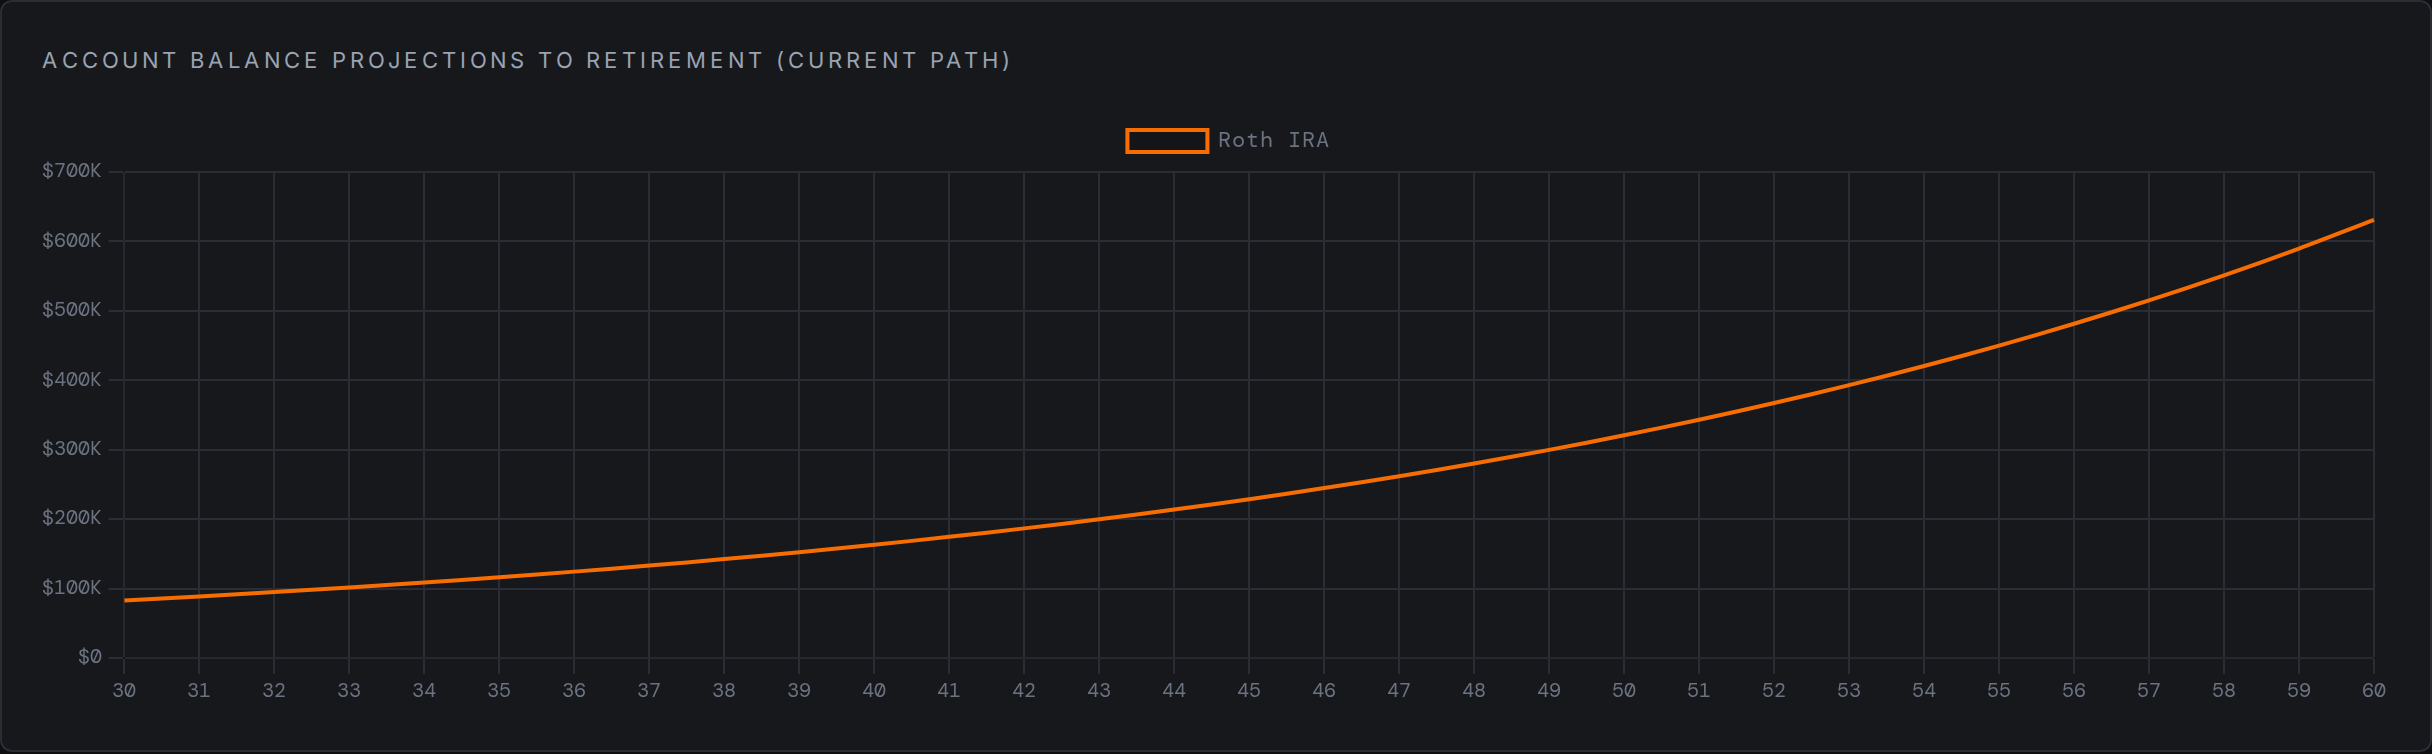
  <figcaption>The same money, left alone from 30 to 60. Nothing added. $631,046.</figcaption>
</figure>

<p>So the saver who paid $60,000 into the account between 20 and 30 and then
stopped has <strong>$631,046</strong> at 60.</p>

<p>The saver who started at 30 and paid in every year until they retired put in
$180,000, three times as much, across three decades of automatic transfers, and
has <strong>$566,765</strong>.</p>

<p>Three times the money, and they finish $64,281 behind.</p>

<p>To actually match the early saver, the late one has to find $6,681 a year rather
than $6,000. Not a dramatic difference in the monthly figure, and $200,415 in
total: three and a third times what the first saver ever paid in, to end up in
the same place.</p>

<div class="callout">
  <p><strong>One number that ties the whole thing together.</strong> The difference between
starting at 20 and starting at 30 is $631,046, and that is exactly what the
account is worth in the second chart above. The entire cost of a ten-year delay
is what that first, unimpressive $82,899 would have gone on to become. Not the
contributions you missed. What they would have turned into.</p>
</div>

<h2 id="what-this-is-assuming">What this is assuming</h2>

<p>Everything above is one deterministic run of the same arithmetic the app applies
to every account: the balance earns its return, then the year’s contribution
lands on top, thirty or forty times over. Which means:</p>

<ul>
  <li><strong>7% every single year, with no variation.</strong> Real markets do not do this, and
the order in which good and bad years arrive matters a great deal, and that is
what the Monte Carlo tab is for. A straight line is a teaching aid.</li>
  <li><strong>These are future dollars, not today’s.</strong> The Growth chart is not
inflation-adjusted. $1,197,811 in 2066 does not buy what $1,197,811 buys now,
and at 2.5% inflation it is closer to $450,000 in today’s money. The
<em>comparison</em> between the three savers survives that intact, because they are
all being deflated by the same amount.</li>
  <li><strong>No fees, and no tax drag</strong>, which is roughly true inside a Roth and
distinctly untrue in a taxable brokerage account.</li>
  <li><strong>Contributions land at the end of each year</strong>, which is the conservative
assumption. Paying in monthly through the year does slightly better.</li>
</ul>

<p>None of that changes the shape of the result. A 1% fee, or a lower return, moves
every one of these numbers, and moves them all in the same direction.</p>

<h2 id="what-to-do-with-this">What to do with this</h2>

<p>If you are in your twenties, the useful takeaway is not “save more”, which is
not advice anybody is short of. It is that the account looking
unimpressive after five years is not evidence of anything. That flat stretch at
the left of the first chart is the part that ends up mattering most, and it is
also the only part that feels like it isn’t working.</p>

<p>If you are past that and reading this with a certain amount of irritation: the
same maths runs forwards from wherever you are now. The gap between starting
today and starting in three years is smaller in dollars than the gap between 20
and 30, but it is the same shape, and it is still the largest single lever you
have that does not require guessing what the market will do.</p>

<p>Either way, the version worth looking at is your own. Put your real age,
balances and contributions into the <a href="/">calculator</a> and open the Growth tab; it
draws exactly the charts above, from your numbers instead of these.</p>

<div class="callout">
  <p><strong>A standing caveat.</strong> Everything here is general information about how
retirement projections work, not individualised financial, tax or legal advice.
The figures are illustrations built from the assumptions stated above, not
predictions.</p>
</div>]]></content><author><name>Chris Savage</name></author><category term="compounding" /><summary type="html"><![CDATA[The same $6,000 a year, started at 20, at 30 and at 40. What compounding does with the difference, and why ten years of saving in your twenties can finish ahead of thirty years of saving after.]]></summary><media:thumbnail xmlns:media="http://search.yahoo.com/mrss/" url="https://retirementmodeler.com/blog/assets/img/cards/the-ten-years-that-beat-thirty.png" /><media:content medium="image" url="https://retirementmodeler.com/blog/assets/img/cards/the-ten-years-that-beat-thirty.png" xmlns:media="http://search.yahoo.com/mrss/" /></entry><entry><title type="html">What this site is for</title><link href="https://retirementmodeler.com/blog/2026/08/what-this-site-is-for/" rel="alternate" type="text/html" title="What this site is for" /><published>2026-08-24T09:00:00-04:00</published><updated>2026-08-24T09:00:00-04:00</updated><id>https://retirementmodeler.com/blog/2026/08/what-this-site-is-for</id><content type="html" xml:base="https://retirementmodeler.com/blog/2026/08/what-this-site-is-for/"><![CDATA[<p>Most people approaching retirement are trying to answer one question, and it is
not a complicated one to state: <strong>do I have enough?</strong></p>

<p>It is, however, genuinely hard to answer. The money is spread across accounts
with different tax treatments and different withdrawal rules. Social Security
depends on when you claim it. Required Minimum Distributions start on a date
that depends on the year you were born. A pension may or may not keep pace with
inflation. And all of it has to be measured against a spending number that is
itself only a guess.</p>

<p>This site is a calculator that holds all of that in one place and projects it
forward, one year at a time, until you either run out of money or you don’t.</p>

<h2 id="how-to-start">How to start</h2>

<p>Open the <a href="/">calculator</a> and work through the guided setup. It asks for your
age, when you would like to retire, the accounts you hold and roughly what you
expect to spend each year. That is enough to produce a projection.</p>

<p>Everything stays editable afterwards. The setup exists so that a first-time
visitor is not confronted with eleven tabs and no idea which one to open; it is
not a one-time gate, and re-running it is a reasonable way to change several
assumptions at once.</p>

<h2 id="what-it-models">What it models</h2>

<ul>
  <li><strong>Year-by-year balances</strong> for pre-tax 401(k), 403(b), 457(b) and TSP, Roth,
traditional IRA, HSA, taxable brokerage, pensions and rental property.</li>
  <li><strong>Social Security</strong> at a claiming age you choose, indexed to inflation.</li>
  <li><strong>Pensions</strong>, with an optional partial COLA, because most are not indexed,
and pretending otherwise is the most common way a plan looks fine and isn’t.</li>
  <li><strong>Required Minimum Distributions</strong> from your SECURE 2.0 applicable age, which
is 73 or 75 depending on your birth year, covering pre-tax and governmental
457(b) balances.</li>
  <li><strong>Taxes on withdrawals</strong>, grossed up. If you need $60,000 to spend, the plan
withdraws enough that $60,000 survives the tax.</li>
  <li><strong>Monte Carlo simulation</strong> over randomised annual returns, so you get a
probability that the plan holds rather than a single deterministic number that
implies more certainty than anyone has.</li>
  <li><strong>Households where two people retire in different years</strong>, each with their own
retirement date, RMD clock and claiming age.</li>
  <li><strong>Named scenarios</strong>, “retire at 60” against “retire at 65”, compared side by
side.</li>
</ul>

<p>Every figure comes from one projection engine, so the Overview, the RMD tab and
the Monte Carlo simulation are all reading the same numbers rather than each
computing their own.</p>

<h2 id="what-it-does-not-do">What it does not do</h2>

<p>Being clear about this matters as much as the feature list:</p>

<ul>
  <li>It is <strong>not advice</strong>. It is a model that does exactly what you tell it to.
Change the assumed return rate and the answer changes, which is the point.</li>
  <li>It does not model <strong>tax brackets</strong>, only a single effective rate. That is fine
for planning and no substitute for a tax preparer in the year you withdraw.</li>
  <li>It does not know about <strong>healthcare before Medicare</strong>, beyond whatever you put
in your spending figure. The gap between retiring at 60 and turning 65 is real
and expensive, and this tool will not remind you about it.</li>
  <li>It does not account for <strong>your specific circumstances</strong>: a divorce decree, a
disability, a business sale, an inheritance. It models the ordinary case.</li>
</ul>

<h2 id="your-data-stays-in-your-browser">Your data stays in your browser</h2>

<p>There is no signup, no account required, and no server doing the maths. The
projection runs in your browser, and everything you enter is stored in that
browser’s local storage. Nothing is transmitted anywhere.</p>

<p>That is also why the site needs JavaScript enabled, and why clearing your
browser data clears your plan.</p>

<p>There is an optional paid tier that adds cloud sync of the same figures across
devices, for people who want to pick up on a phone where they left off on a
laptop. Every projection, scenario and Monte Carlo feature is free and always
will be. The paid tier adds sync, not maths.</p>

<h2 id="what-this-blog-is-for">What this blog is for</h2>

<p>Mostly, explaining the assumptions.</p>

<p>Any retirement calculator is a pile of assumptions wearing a single number as a
disguise, and the useful thing is usually not the number but knowing which
assumption it is resting on. So these posts work through them one at a time:
<a href="/blog/2026/08/what-the-projection-actually-assumes/">what the projection actually assumes</a>,
<a href="/blog/2026/08/the-gap-year-problem/">how a household where two people retire in different years is modelled</a>,
and more as they come up.</p>

<p>If you would rather watch than read, the app has short narrated walkthroughs of
each feature under its Videos tab, and a How It Works tab that explains every
formula in plain language.</p>

<div class="callout">
  <p><strong>A standing caveat.</strong> Everything here is general information about how
retirement projections work, not individualised financial, tax or legal advice.
The figures this tool produces are estimates built from assumptions you supply,
and they are not predictions.</p>
</div>]]></content><author><name>Chris Savage</name></author><category term="start here" /><summary type="html"><![CDATA[A free retirement calculator that answers one question: do I have enough to retire? What it models, who it is for, and what it deliberately leaves out.]]></summary><media:thumbnail xmlns:media="http://search.yahoo.com/mrss/" url="https://retirementmodeler.com/blog/assets/img/cards/what-this-site-is-for.png" /><media:content medium="image" url="https://retirementmodeler.com/blog/assets/img/cards/what-this-site-is-for.png" xmlns:media="http://search.yahoo.com/mrss/" /></entry><entry><title type="html">The gap year problem</title><link href="https://retirementmodeler.com/blog/2026/08/the-gap-year-problem/" rel="alternate" type="text/html" title="The gap year problem" /><published>2026-08-20T09:00:00-04:00</published><updated>2026-08-20T09:00:00-04:00</updated><id>https://retirementmodeler.com/blog/2026/08/the-gap-year-problem</id><content type="html" xml:base="https://retirementmodeler.com/blog/2026/08/the-gap-year-problem/"><![CDATA[<p>Say you plan to retire at 62 and your spouse, four years younger, plans to keep
working until 65. For seven years the household is in a strange state: one
salary still coming in, one person drawing down, and a set of accounts that
belong to different people with different rules.</p>

<p>Most retirement calculators cannot describe that period at all. They ask for
<em>a</em> retirement age, put every account in one pile, and switch the whole
household from “saving” to “spending” on a single date.</p>

<h2 id="why-one-pile-is-wrong">Why one pile is wrong</h2>

<p>The problem is not precision, it is direction. Collapsing the household into one
portfolio makes two errors that both flatter the plan:</p>

<ol>
  <li><strong>It lets the plan spend money it cannot reach.</strong> Your spouse’s 401(k) is not
available to fund your spending at 62 without penalty. A single pooled balance
quietly assumes it is.</li>
  <li><strong>It stops contributions too early.</strong> Your spouse is still working and still
contributing for another seven years. Ending all contributions at the first
retirement throws away seven years of deferrals and match.</li>
</ol>

<p>Net of the two, the pooled model tends to look <em>more</em> achievable than the real
thing in the early gap years and then run short later.</p>

<h2 id="accounts-carry-their-own-rules">Accounts carry their own rules</h2>

<p>The fix is to stop treating money as four buckets (pre-tax, Roth, taxable, HSA)
and start treating it as pools that belong to someone. Each pool carries the
rules that govern it: who may draw from it, until when it receives
contributions, and which RMD clock it is on.</p>

<p>During the gap, then:</p>

<ul>
  <li>The plan draws only from pools belonging to whoever has actually retired.</li>
  <li>It keeps contributing to the still-working partner’s accounts.</li>
  <li>Jointly held money is drawable from the <strong>first</strong> retirement but keeps
receiving contributions until the <strong>last</strong> one.</li>
</ul>

<p>That last rule is the one that looks inconsistent and is not. A joint brokerage
account genuinely is spendable the day either of you stops working, and it
genuinely does keep growing from the salary that is still arriving.</p>

<h2 id="the-safety-property">The safety property</h2>

<p>There is an obvious risk in adding this machinery: that it changes the answer
for the millions of households it should not apply to. A single person has no
gap year, and their projection must come out exactly as it did before.</p>

<p>So pools whose rules match get merged before the projection runs. A single-owner
household collapses to one pool and produces bit-for-bit the same numbers as the
old four-bucket model. The staggered logic only ever engages when there is
actually a stagger to model.</p>

<div class="callout">
  <p><strong>One number to watch.</strong> In a staggered household, “when do I retire” and “when
does the plan start drawing down” are different dates. A shortfall warning that
measures against total spending rather than the portion actually funded by the
portfolio will report a phantom shortfall in every gap year, when a salary is
covering it perfectly well.</p>
</div>

<h2 id="what-to-do-with-this">What to do with this</h2>

<p>If you are modelling a couple with an age gap, the two inputs worth being
deliberate about are the spouse’s retirement age and the spouse’s Social
Security claim age. Both default to something reasonable, and neither default is
right for everybody. The gap years are where a plan is most fragile and where
the assumptions are least visible. That is a bad combination to leave on
autopilot.</p>]]></content><author><name>Chris Savage</name></author><category term="couples" /><category term="methodology" /><summary type="html"><![CDATA[When one partner retires years before the other, the household is neither fully working nor fully retired. Most calculators cannot express that, and the error runs in an optimistic direction.]]></summary><media:thumbnail xmlns:media="http://search.yahoo.com/mrss/" url="https://retirementmodeler.com/blog/assets/img/cards/the-gap-year-problem.png" /><media:content medium="image" url="https://retirementmodeler.com/blog/assets/img/cards/the-gap-year-problem.png" xmlns:media="http://search.yahoo.com/mrss/" /></entry><entry><title type="html">What the projection actually assumes</title><link href="https://retirementmodeler.com/blog/2026/08/what-the-projection-actually-assumes/" rel="alternate" type="text/html" title="What the projection actually assumes" /><published>2026-08-10T09:00:00-04:00</published><updated>2026-08-10T09:00:00-04:00</updated><id>https://retirementmodeler.com/blog/2026/08/what-the-projection-actually-assumes</id><content type="html" xml:base="https://retirementmodeler.com/blog/2026/08/what-the-projection-actually-assumes/"><![CDATA[<p>A retirement calculator that gives you a single number is telling you about its
assumptions at least as much as it is telling you about your money. This one is
no different. The difference is that these are written down.</p>

<h2 id="todays-dollars-inflated-forward">Today’s dollars, inflated forward</h2>

<p>The two figures you enter for spending and Social Security, <code class="language-plaintext highlighter-rouge">retireSpend</code> and
<code class="language-plaintext highlighter-rouge">ssIncome</code>, are <strong>today’s dollars</strong>. Internally they are inflated forward from
your current age to the year being projected, so a $70,000 spending target at
age 45 is not $70,000 at age 70; it is whatever $70,000 buys then.</p>

<p>This matters because the alternative convention, entering future dollars, is
almost impossible to do consistently. Nobody has an intuition for what their
grocery bill will be in 2051.</p>

<h2 id="social-security-gets-a-full-cola-pensions-do-not">Social Security gets a full COLA. Pensions do not.</h2>

<p>Social Security benefits are indexed to inflation, so the projection grows them
at the full inflation rate every year. Most private pensions are not indexed at
all, and public ones are usually partially indexed. So pension income is grown
only by whatever COLA you give it, defaulting to none.</p>

<p>Over a thirty-year retirement that difference is enormous. A $30,000 pension
with no COLA against 2.5% inflation is worth about $14,300 in today’s money by
year thirty. Treating it as inflation-proof is the single most common way a
plan looks fine on paper and does not hold.</p>

<h2 id="withdrawals-are-grossed-up-for-tax">Withdrawals are grossed up for tax</h2>

<p>If the plan needs $60,000 of spending money out of a pre-tax 401(k), it does not
withdraw $60,000. It withdraws enough that $60,000 survives the tax, at the
effective rate you supply. Calculators that skip this step systematically
overstate how long a portfolio lasts, because they quietly spend the government’s
share too.</p>

<h2 id="rmds-start-at-your-applicable-age-not-at-70-or-72">RMDs start at your applicable age, not at 70½ or 72</h2>

<p>Required Minimum Distributions have moved twice in recent years, and a lot of
material online is still out of date. Under SECURE 2.0 the applicable age
depends on when you were born:</p>

<table>
  <thead>
    <tr>
      <th>Birth year</th>
      <th>RMD applicable age</th>
    </tr>
  </thead>
  <tbody>
    <tr>
      <td>1951–1959</td>
      <td>73</td>
    </tr>
    <tr>
      <td>1960 or later</td>
      <td>75</td>
    </tr>
  </tbody>
</table>

<p>The projection derives this from your birth year rather than hardcoding a number,
and applies it to pre-tax balances <strong>and</strong> governmental 457(b) balances, which
are easy to forget.</p>

<h2 id="couples-run-on-two-clocks">Couples run on two clocks</h2>

<p>If you are modelling a household, the projection is indexed to one person’s age,
the primary’s, but the spouse has their own retirement age, their own RMD cohort
and their own Social Security claim age. All of it gets converted onto the shared
axis.</p>

<p>One consequence is worth stating outright, because the default surprises people:
leaving the spouse’s retirement age blank means <em>“retires in the same calendar
year you do”</em>, not <em>“retires at the same age number”</em>. For a couple six years
apart those are wildly different plans, and the second one invents a six-year
staggered window that nobody asked for.</p>

<div class="callout">
  <p><strong>These are estimates, not forecasts.</strong> The return rate, the inflation rate and
the tax rate are inputs you choose. Change any of them and the answer changes.
That sensitivity is the useful part: it tells you which assumptions your plan
is actually resting on.</p>
</div>

<h2 id="what-it-does-not-model">What it does not model</h2>

<p>Being explicit about the gaps matters as much as the assumptions:</p>

<ul>
  <li><strong>Sequence-of-returns risk</strong> is not in the deterministic projection at all. It
assumes a steady annual return. Use the Monte Carlo tab for that.</li>
  <li><strong>Tax brackets</strong> are a single effective rate, not a bracket schedule. Good
enough for planning; not a substitute for a tax preparer in the year you
actually withdraw.</li>
  <li><strong>Healthcare before Medicare</strong> is only whatever you put in your spending
figure. The gap between retiring at 60 and turning 65 is a real and expensive
thing this tool will not remind you about.</li>
</ul>]]></content><author><name>Chris Savage</name></author><category term="assumptions" /><category term="methodology" /><summary type="html"><![CDATA[Every retirement calculator hides a pile of assumptions behind one number. Here are the ones this tool makes, stated plainly, so you can judge whether the answer applies to you.]]></summary><media:thumbnail xmlns:media="http://search.yahoo.com/mrss/" url="https://retirementmodeler.com/blog/assets/img/cards/what-the-projection-actually-assumes.png" /><media:content medium="image" url="https://retirementmodeler.com/blog/assets/img/cards/what-the-projection-actually-assumes.png" xmlns:media="http://search.yahoo.com/mrss/" /></entry></feed>