Your Coast FIRE number is lower than you think
The formula every Coast FIRE calculator uses assumes your portfolio pays for all of retirement. Most people's does not have to. What Social Security does to the number, and how to work it out properly.
Coast FIRE is the most useful idea the financial independence movement has produced, and it is the one most often calculated wrong.
The idea is simple enough to hold in your head. There is some balance which, if you never added another dollar to it, would grow on its own into a retirement you can actually afford. Reach it and the arithmetic changes character: you still have to earn a living, but you no longer have to save. You can take the job that pays less. You can go to four days a week. You can stop opening the statement.
The number is worth knowing precisely, because people make real decisions with it. And the formula everybody uses to find it is wrong in a specific and consistent direction: it tells you the number is much bigger than it is.
The formula everyone uses
Every Coast FIRE calculator on the internet does the same two steps.
First, your FI number (what you need on the day you retire) is your annual spending divided by a safe withdrawal rate, conventionally 4%. That is the familiar 25x.
It is worth being clear which way that dial turns, because it reads backwards to almost everyone the first time. The withdrawal rate is not how much you spend. Your spending is whatever you decided it was. It is what fraction of the portfolio that spending represents. So a more cautious 3.5% is 29x rather than 25x, and it asks for a bigger pot, not a smaller one, because the same $70,000 has to come out of a portfolio you are willing to draw on more lightly.
Then discount it back to today at your expected real return:
Coast number = FI number / (1 + r)^years
Take a 42-year-old who wants $70,000 a year and plans to stop at 65. Their FI number is $1,750,000. At 7% growth and 2.5% inflation the real return is 4.4%, and over 23 years that discounts to $651,418.
So: $651,418 today, and you never have to save again. It is a clean piece of arithmetic and it has the great virtue of fitting on a napkin.
It is also describing a retirement that almost nobody has.
It assumes your portfolio pays for everything
Look at what 25x actually says. It says your portfolio must produce every dollar you spend, for the rest of your life, on its own.
For most people it does not have to. Social Security is going to pay something. Many people have a pension. Some have rental income. Those are not rounding errors. For a household spending $70,000 a year, a $30,000 Social Security benefit is nearly half the bill, arriving every year, inflation-adjusted, for as long as you live. The formula has no way to express it, so it silently asks you to save as though it did not exist.
There is a second, quieter assumption. The 4% rule is built to survive indefinitely: it is designed so the money never runs out, no matter how long you live. A projection that runs to 100 is answering a narrower question, and a narrower question needs less money.
The Coast FIRE tab on this site does not use the formula. It takes the plan you have already described (your accounts, your spending, your Social Security timing, your tax rates) switches every contribution off, yours and your employer’s, and runs the whole projection forward. Then it solves for the balance that just carries it. Same household, same day, both numbers:


The gap is $284,269. It is not a rounding difference or a modelling quibble: it is 44% of the number, and it is the difference between “I am nowhere near” and “I am closer than I thought”.
It comes from the two assumptions, and they can be separated. Run the same household with Social Security deleted and the projection asks for $547,646:
| Coast number for the same household | Amount |
|---|---|
| Rule of thumb, 25x discounted | $651,418 |
| Full projection, no Social Security | $547,646 |
| Full projection, $30,000 of Social Security at 67 | $367,149 |
So about $104,000 of the gap is the 4% rule aiming at perpetuity where the
projection aims at age 100, and about $180,000 of it is Social Security. The
second is the larger effect, and it is the one the napkin cannot ever capture,
because there is nowhere in FI / (1 + r)^n to put it.
Where the line actually is
The number on its own is a milestone with no date attached. The more useful question is when you get there, and that has a shape worth looking at.
Two lines. One is your balance if you carry on contributing exactly as you are. The other is what you would need at each age to coast from that age, which rises, because every year you wait is a year of compounding you no longer get. Where they meet is your Coast FIRE date.
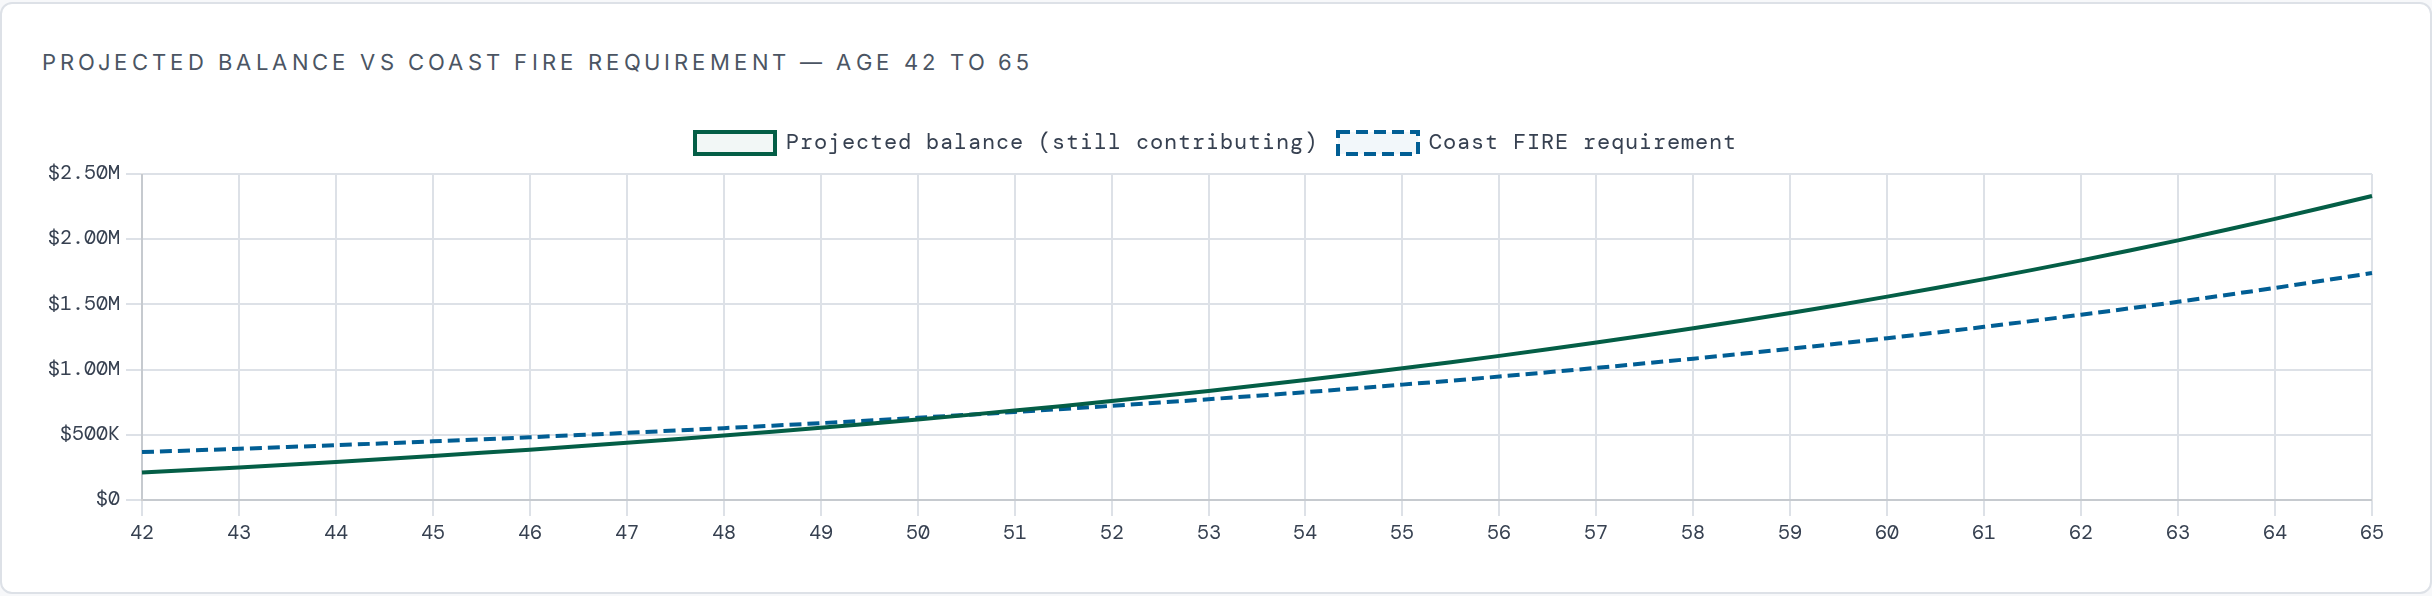
Nine years, not never. That is the thing the chart tells you that the number alone does not: this saver is not choosing between saving until 65 and giving up. They are nine years from the point where continuing to save becomes optional.
Notice also how the two lines behave after they cross. The requirement keeps rising, but the balance rises faster, because it is compounding and being fed. Past the crossing, every additional year of contributions is buying margin: an earlier retirement, a bigger number, a worse decade absorbed, rather than the plan itself.
What this is assuming
Coast FIRE is a projection, and it inherits every weakness projections have. Four are worth stating plainly.
The spending target is doing most of the work, and it is the number most likely to be wrong. Everything above is downstream of $70,000 a year. Expenses at 42 rarely resemble expenses at 65. Children arrive and leave, parents need help, houses need roofs. If the real figure turns out to be $85,000, the coast number moves by more than any assumption argued about on the internet.
A flat 7% hides the order the returns arrive in. The projection grows the balance by the same percentage every year. Real markets do not, and a bad first decade of coasting cannot be made up by a good second one in the way the average implies. The Monte Carlo tab exists for exactly this reason; run the plan through it before you act on a single deterministic line.
Stopping early means paying for health insurance yourself. Anyone who coasts out of a job with benefits before 65 is buying their own cover until Medicare, and that is a real annual cost this projection does not model as a separate item. If that is the plan, put it in the spending target.
Coasting is easier to start than to stop. This one is not arithmetic. The habit of saving is difficult to restart once broken, and the flexibility you bought by coasting can quietly become a floor you cannot climb off. Reaching the number is permission to stop, not an instruction to.
And one thing that is not a caveat but is often mistaken for one: the projection lets the portfolio run down toward zero by 100. That is deliberate, since money left over at 100 is money that was not spent, but it is a different target from the 4% rule’s, and it is part of why the numbers differ.
What to do with this
Put your own figures into the calculator, real balances and real contributions, your actual Social Security estimate from ssa.gov rather than a guess, and open the Coast FIRE tab. It will show you both numbers, the gap between them, and the age the lines cross.
Then do the thing the number is actually for, which is not to stop saving. It is to find out how much of your current saving is load-bearing. Most people discover they are further along than the napkin told them, and that some part of what they are putting away is buying margin rather than buying the retirement. Knowing which is which is what lets you make the trade deliberately (fewer hours, a better job, a worse-paid one that you like) instead of saving hard until 65 because nobody ever told you when you could stop.
If the compounding underneath all of this is unfamiliar, the ten years that beat thirty makes the same point from the other end: it is time, not the rate, that does the work.
A standing caveat. These are projections, not predictions, and every figure here came out of one household’s assumptions. Nothing on this site is financial, tax or legal advice, and no calculator knows what the next thirty years of markets will do, including this one. Use it to understand the shape of the problem, then talk to someone who is licensed to advise you on your own.